

Demystifying Directional Bass
To anyone who understands a bit about the behaviour of low frequency sound waves, directional bass might seem physically implausible. But as Hugh Covill points out, directional bass is not only a physical reality, it’s an idea that’s been around for decades.
30 September 2005
Text: Hugh Covill
‘Everything old is new again’ seems to be the catch-cry of the audio industry. Companies look to be clamouring to reissue everything from classic compressors and preamps to vintage tube mics. You’ve all read the hype… “built to original specifications with parts snaffled directly from Rupert Neve’s garage” etc etc. A colleague and I were recently discussing this phenomenon over a quiet ale or three when the conversation turned to this question: “What have been the defining inventions/products/breakthroughs in conceptual thought that have most affected us audio folk? What are the really big moments in history as they relate to sound? So what did we determine?
Well, there’s the understanding and harnessing of electricity, that’s a given. Then there’s Thomas Edison’s invention of the phonograph… moving coil speaker design… the work in electro-acoustics by Bell Labs (particularly in the ’30s and ’40s)… third-octave equalisation, patented by Don Davis in the mid ’60s… and, more recently, DSP which has resulted in digitally-steerable loudspeaker arrays and variable room acoustic systems.
These are just a few of the important landmarks we managed to recall. What struck me most about our list was that (excluding digital technologies) most of the founding concepts that underpin how we work with sound were laid down a long time ago.
Which brings us to Dr Harry F Olson, one of the forefathers of modern electro-acoustics. Last year I attended a seminar (conducted by Meyer Sound), which, among other things, tackled the concept of directional bass arrays. This concept (along with most contemporary line source theory) was first described in Dr Olson’s book ‘Acoustical Engineering’ which was published way back in 1939! This book has been out of print for many years but has now become available again via www.audioxpress.com/bksprods/books/bkpa1.htm
For anyone with a sense that there’s a science behind the practice of putting up speakers, this book is still the definitive work.
BACK TO THE FUTURE
So, having doffed our caps to those that paved the way, let’s take a look at the concept of directional bass… or low frequency directivity, or whatever other moniker you wish to call it. Most audio people happily admit that bass is omni-directional in nature. They’re right, of course. A single, forward-firing subwoofer in free space will exhibit an omni-directional frequency response. This situation changes, though, when we introduce a second sub (and subsequent sources after that). You’ve all heard the phenomenon in action, and you may well have heard the related term ‘power alley’ at some point.
THE POWER ALLEY
As you walk around a room the low frequency response can often seem noticeably uneven. In the past, my initial response to this phenomenon has always been to get out my calculator and start looking at the axial room modes. Is there a standing wave? Often the room can play a pivotal part in shaping a sound system’s frequency response. But what this seminar impressed upon me was the need to consider the phase relationship of the bass sources. As soon as you’re utilising more than a single bass cabinet, you’re changing the polar response in the bass frequencies. If this change in polar response is not considered, the results can be disastrous for both the audience coverage (uneven levels) and for the stage sound (poor gain before feedback at low frequencies).
It is beyond the scope of this article to discuss room factors in any detail. Let’s assume our bass sources are in free space and I’ll outline just how a particular technique for arraying these sources can control the distribution pattern. Disclaimers aside, let’s look at some definitions. What is phase? What constitutes an array? What is polar response?
Well, to answer the last question first, polar response is a plot of the variation in radiated energy with angle relative to the axis of the radiator – in effect, it’s about how loud you hear frequencies as you walk a circle around a speaker. Traditionally this information is disseminated in the form of overlaid vertical and horizontal graphs on a 360º circumference drawn around the speaker. Polar response graphs are generally seen on speaker and microphone data sheets. A more recent innovation is what is termed the ‘3D polar (or attenuation) balloons’ and these represent a significant improvement over the traditional graphs as the method of generating them involves thousands of impulse response measurements (dependent on the resolution).
Array – An array is a combining of point sources that permit acoustical coupling. Arraying speakers is one technique for steering sound energy. The ways in which arrays steer energy (the polar response) is governed by (and this is the important bit): the number of sources, their comparative levels, their polarity, distance between the sources and any relative delay. They are frequency dependent.
Phase – is a much-misunderstood term in audio. I suspect some of the blame lies with the console manufacturers who continue to (erroneously) identify their polarity reversal switches with the phase symbol ø. Being 180° ‘out-of-phase’ and having ‘inverse polarity’ are quite contrary. The best definition of phase I’ve spotted is this one: “phase is the conversion of time (or distance) related to the wavelength of a given frequency.” If you want to examine the relationship between phase and distance, here are the equations:

The simple concept of superposition of waves is the foundation of pattern control. Dr. Olson understood this and demonstrated that placing devices different distances apart (relative to the wavelength) produced a predictable dispersion pattern at that frequency.
Here’s how two sources (of the same level) sum at a variety of degrees apart in phase.
| Difference in Degrees | Summation in decibels | |
| 0 | 6dB | |
| 45º | 1/8 of a wave | 5dB |
| 90º | 1/4 of a wave | 3dB |
| 120º | 1/3 of a wave | 0dB |
| 180º | 1/2 of a wave | Infinity (theoretical silence) |
| 240º | 2/3 of a wave | 0dB |
| 270º | 3/4 of a wave | 3dB |
At different audio frequencies the size differences of wavelengths is enormous. It takes a certain amount of time to travel that distance (the speed of sound), the less distance to travel the faster the trip – the shorter the wavelength the shorter the trip time. This is why phase is frequency dependent. Thus, if we know the distance two speakers are apart we can express this as a Phase (°) value. Similarly, if we know how far apart in phase we’d like to place our speakers we can convert this to a distance value.
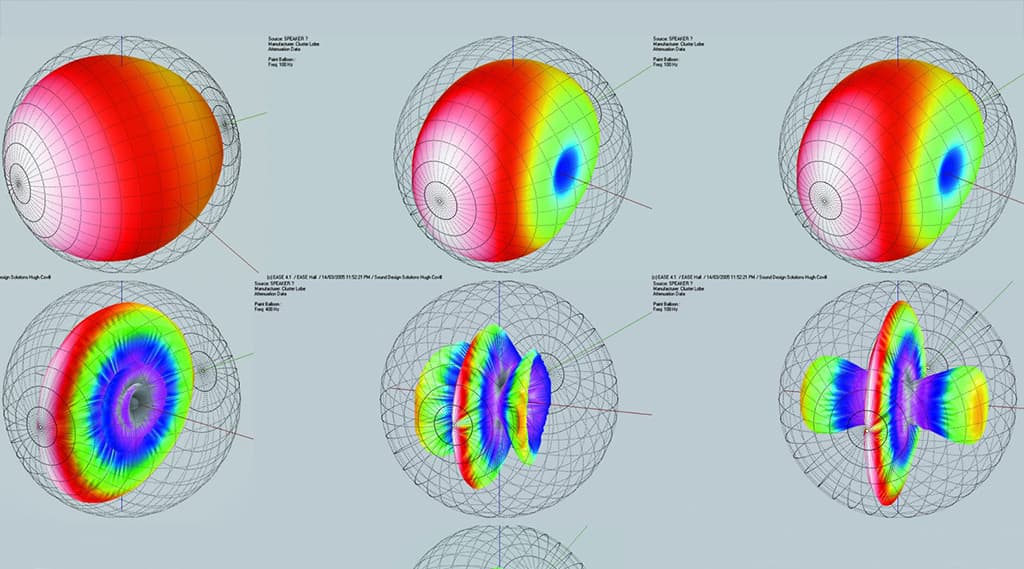
Let’s now look at some diagrams which demonstrate the principals. Fig. 1 shows a 3D representation of a single subwoofer in free space. It shows the polar response at a particular frequency: 100Hz. Now let’s look at two, then four, then eight subs in a line and view what happens to the dispersion pattern. Remember that when we’re calculating the distance in degrees it is always relative to a particular frequency. When working with subs, and this technique, it is generally conceded that the upper crossover frequency is the best frequency to work from. This is usually around 120Hz, but I’ll select 160Hz for these particular illustrations, as it will provide us with a larger viewing window.
Most loudspeaker manufacturers can’t measure polar data below 100Hz; in fact, many can’t get really reliable data much below 200Hz. You need a big room in which to suspend your loudspeaker to accumulate that sort of data accurately. Fig. 2 shows the plots for two subs, Fig. 3 for four subs and Fig. 4 for eight sub speakers at 240° apart. These plots are taken at 160Hz. Take note of the narrowing of the dispersion pattern in the horizontal plane – there is less and less low-frequency energy radiated at 90° to the array the more boxes you add. As long as the distance between the boxes remains 240° or less and the same distance measure is used for all boxes, then similar pattern control can be achieved.


Figures 1 to 4 show the narrowing polar response of a 160Hz point source as you array more subs together side by side. Fig. 1 shows one sub in free space then Fig. 2 show two subs, then four, then eight.
CLASSIC ARRAY
What these pictures demonstrate is a classic line array. Our array will not be particularly useful for anything except a narrow and deep seating area. If we stacked our subs vertically (maintaining the horizontal coverage over the audience area) we would have a far more useful array – as there would be less energy shot into the roof and floor. There are various incarnations of this technique, the main ones being: the single vertical line I just mentioned, a cardioid pattern created by placing the subs in a line one behind the next and splayed horizontal lines. All have the same common denominator; that is, they require no elaborate DSP networks (although the cardioid configuration does require discrete delays and polarity control) just ol’ fashioned placement of boxes with regard to the wavelength of the octave band you are wishing to control. So for subs this is really a potentially helpful tool, as you’re only really talking about two octave bands. The pattern will be most effective at the cut-off frequency, which in the case of the previous illustrations was 160Hz. Much beyond that and the control breaks down and you start to see lobing (see Fig. 5 that shows the balloon for 400Hz) but that’s okay because your subs won’t generally be reproducing those frequencies – a crossover would traditionally be used with a steep filter from perhaps 120Hz.
Travelling in the other direction along the frequency spectrum you can expect the pattern to become more omni-directional the lower you go. This is dependent upon where you have selected the upper frequency. What happens if you exceed the 240° spacing between sources? Well, the pattern starts to exhibit lobing again (uneven level). Remember, the polar balloon pictures describe a number of sources combined to a single point source (with the directivity of the combination). Let’s take a look at an attenuation balloon for eight elements (speakers) spaced a wavelength apart (see Fig. 6). The directionality is still apparent but the extra distance has introduced quite severe side lobes.


(Figures 5 to 7) If care isn’t taken when arraying or positioning subs you’re quite likely to experience the type of severe lobing (uneven level) you can see in these diagrams. Fig. 6 shows what occurs when you place subs more than a wavelength (at the crossover frequency) apart. Even subs placed either side of the stage will couple at lower frequencies, so care must be taken or else you’re likely to find yourself at the receiving end of a plot like you see in Fig. 7.
PENNY DROPPING
The penny dropped for me when I realised that at low frequencies (because the wavelength is really long), subs quite a way apart are still acting as an array. So it’s not enough to consider how a single stack of subs will act as an array, you often have to think about how separate left and right stacks will couple. Here’s a practical example: on a mid-sized stage, subs are 10 metres apart. A 10-metre distance is within two wavelengths for the frequency range 40-70Hz. Consequently the coverage is likely to vary in level at these frequencies. Here’s a free space (extrapolated) polar balloon for 40Hz (see Fig. 7). The lobes are as much as 20dB deep. Of course free space is only a ‘ballpark’ for the real world. There are many factors (not least the room!) that combine to shape a sound system’s performance. At lower frequencies (particularly) it is important to consider the placement of the speakers relative to the physical length of the wave.
STOPPING FOR DIRECTIONS
So there we have it: a summary glance at the concept of directional bass. A concept first described in the 1930s served fresh for a new generation of audio folk. Virtually all of the current developments in line source theory owe a debt of gratitude to Dr. Olson. True enough, most of the current crop of these devices are making hay with the available, ubiquitous and powerful DSP chips that now permeate the industry. This is a great thing and has brought degrees of refinement of techniques. Bundle this with the advent of proprietary wave-guides and high frequency manifolds and we’re starting to see some amazingly engineered speaker enclosures.
Sound reinforcement is at a pivotal period. New technologies offer new possibilities for extending and redefining existing paradigms. Just like refinements in cabinetry gave us Stradivarius violins and solid state transistors gave us the MiniMoog, current advances in computer and mechanical technologies have made line arrays more sophisticated and more viable at higher frequencies – but as I’ve mentioned, the idea (or paradigm) is far from new. The theory as it relates to lower frequencies is a good place to start understanding these arrays more generally. Viva directional bass.
And what does the future hold? Well, I’m betting we’ll see more of the ‘latest and greatest’ sourced from yesteryear. My tipsters tell me to look out for a return of the Bessel array and wave-guides that will reference the long-throated horns of the late ’60s. Go figure.


RESPONSES-
Pingback: How To Listen To Music On 5.1 Surround Sound Speakers In Your Home Studio - SoundsWow